
Traffic Outage Detection in ISPs
ThousandEyes currently detects traffic outages associated with Internet service providers based on de-identified data collected from tests running across our user base. This is useful context to have available in order to more quickly determine who (your team, another group in your organization, or a critical ISP) can best resolve the root cause of an identified issue, and ultimately mitigate the impact of a problem to your business.
Using Traffic Outage Detection
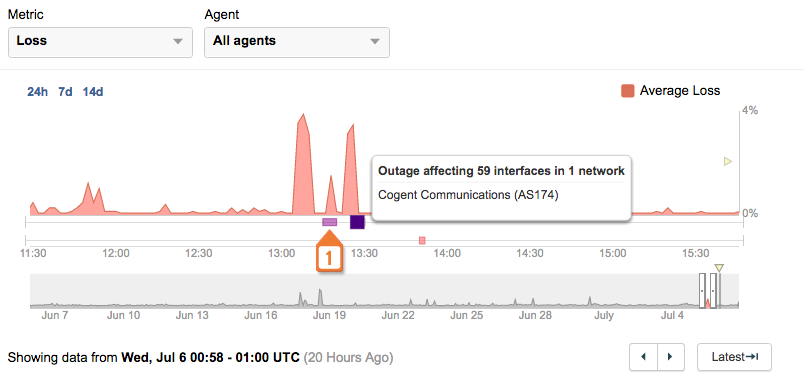
When ThousandEyes alerts, user complaints or another source surfaces an issue, purple indicators (1) may appear in the swimlane of the timeline above the Path Visualization in one of the affected tests. These indicate time periods during which the conditions for a traffic outage have been met.
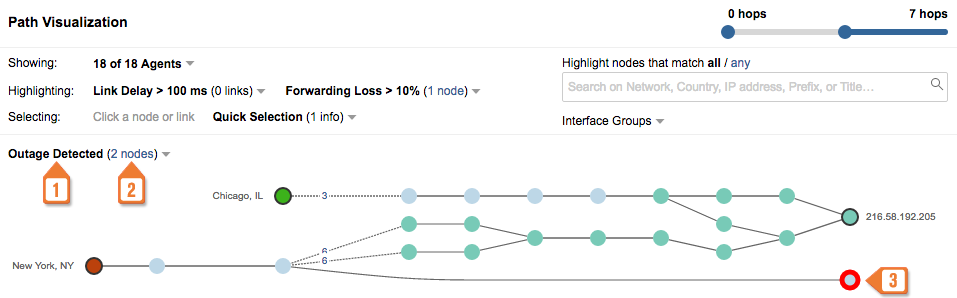
During time periods when an outage has been detected, the ‘Outage Detected’ dropdown will appear (1) in the top left area of the Path Visualization window. Click the ‘N nodes’ link (2) beside ‘Outage Detected’ to quickly select the nodes in the Path Visualization that are affected by the outage.
Note: Alerts cannot be configured for Outage Detection, but they can be configured based on test metrics that are likely to coincide with detected outages.
Hovering over a terminal interface—a node circled in red (3)—will provide details about that interface and whether the interface is associated with an outage (for more details, see the the Terminal Interface Context Knowledge Base article):
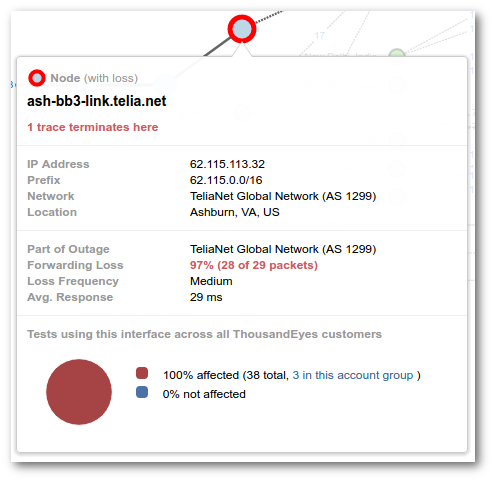
This terminal interface is part of an outage. To see more details about the breadth and scope of the outage, click on the ‘Outage Detected’ dropdown and you’ll see the following:
Affected Tests tab
At the top of the Outage Detection window, see the Internet service provider and associated autonomous system number that is experiencing the outage (1).

Under the ‘Affected Tests’ tab, see the list of all tests within your Account Group that were affected by this outage and a link to directly access those tests (2), as well as the number of affected interfaces in each test (3).
The more tests that are affected, the bigger impact an outage has on your organization. Refer back to the Terminal Interface Context article to understand the scope of an outage in terms of the number of tests affected beyond your own organization.
Locations tab
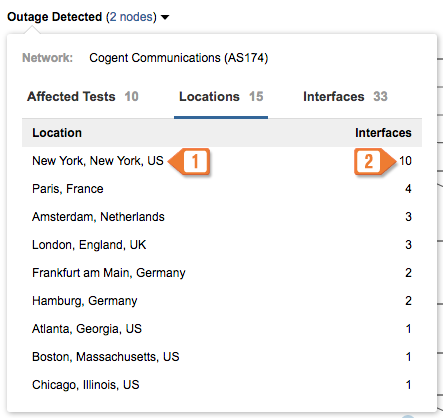
This is the list of geographic locations containing interfaces that were affected by this outage across all ThousandEyes users (1), along with the number of affected interfaces (2) at each location. This view will show how geographically widespread an outage is.
As the number of affected locations increases, so does the likelihood that the outage was widespread across different geographies. Combined with the number of interfaces affected at each location, you should get a good understanding of the scope of the outage.
Interfaces tab
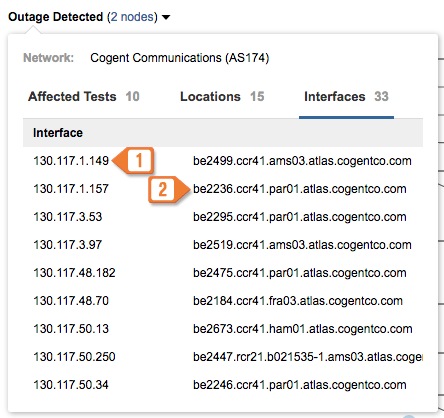
This is the list of all terminal interfaces involved in the outage across all ThousandEyes users. Interfaces are identified with both the interface’s IP address (1) and hostname (2), if available (based on publicly available reverse DNS lookup).
This can be useful for aligning with other data sources and verifying whether the outage was specifically responsible for any performance degradation experienced within your organization’s network and user base.
How Traffic Outage Detection Works
Traffic Outage Detection aggregates incidences where path traces are terminating (i.e., where 100% of packets are being dropped) in the same autonomous system. We define a traffic outage as an event that meets all of the following conditions across all tests in our system:
-
2 or more Cloud or Enterprise Agents affected
-
2 or more tests affected
-
5 or more interfaces affected
During the time period when an outage is occurring, the ‘Outage Detected’ dropdown will appear. The adjacent link will select all of the affected terminal interfaces in the path visualization. Hovering over these terminal interfaces will provide more information about this interface, including whether other users have seen issues with this interface as well. See the related Terminal Interface Knowledge Base article for more information.
Affected geographic locations are based on the geolocation of terminal interfaces and are inferred based on a combination of reverse DNS pattern matching and geolocation services.
To filter out noise, issues in certain locations and interfaces are excluded from Outage Detection, including:
-
All networks that are not Internet Service Providers (identified using a proprietary algorithm to classify ISPs), including networks that are the source or destination of a test
-
Noisy interfaces (see the Terminal Interface Context article)
-
All traffic other than TCP traffic to ports 80 and 443
-
Interfaces with inadequate geolocation information
More Information
Read our Knowledge Base article to learn more about using Outage Detection.